
Following on from last weeks post where we looked at how to model Prem Rugby data in Neo4j, we’ll now start to look at how we can extract information and insight.
As a brief introduction let’s see how many fixtures for each team are in the database (which is a selection of some Opta data from dates between 2016 and 2020).
MATCH (t1)-[:TEAM_PLAYED_IN]->(f:Fixture)
RETURN t1.name as teamName, COUNT(*) as numFixtures

+-----------------------------------+
| teamName            | numFixtures |
+-----------------------------------+
| "Leicester"         | 45          |
| "Newcastle Falcons" | 34          |
| "Harlequins"        | 48          |
| "Worcester"         | 43          |
| "Gloucester"        | 46          |
| "Exeter"            | 52          |
| "Northampton"       | 47          |
| "Saracens"          | 47          |
| "Sale"              | 47          |
| "Wasps"             | 44          |
| "London Irish"      | 27          |
| "Bath"              | 39          |
| "Bristol"           | 25          |
+-----------------------------------+
Try Scoring Sequences
So let’s get stuck straight in, we’ll not mess around finding number of carries, tackles etc, this is fairly easy using relational databases. We’ll use the strength of graph databases to look at relationships between events. We’ll start by looking at the events that lead to a try, similar to last weeks blog post.
/* Match any chain of events up to length 100 that are part of the same sequence */
MATCH p=(e:Event)-[:NEXT_EVENT_PER_TEAM*..100]->(t:Try) WHERE e.sequenceId = t.sequenceId

/* Only return the path where the first event s the start of the sequence (avoid all sub-paths) */
MATCH (pre:Event)-[:NEXT_EVENT_PER_TEAM]->(e) WHERE pre.sequenceId <> e.sequenceId

MATCH (team:Team)-[:FIXTURE_EVENT]->(e)<-[:HAS_EVENT]-(f:Fixture)

/* Return the ActionType of each event along with the matchTime and subtract the min from the max times */
WITH team.name as teamName, [n in nodes(p) | labels(n)[1]] as events, [n in nodes(p) | n.matchTime] as times
RETURN teamName, events, times[-1] - times[0] as sequenceLength LIMIT 100
What would this look like in SQL? I’m not sure whether to be embarrassed or proud of this query…
WITH row_query AS
(
/* We want to take every team and fixture and give each row a number, this will help with ordering the events */
  SELECT
    FXID,
    team_id,
    sequence_id,
    `action`,
    ROW_NUMBER() OVER (PARTITION BY FXID, team_id, sequence_id ORDER BY ps_timestamp) row_num
  FROM
    match_data
),
try_action_row AS (
/* Now, we want to take only the rows that contain a try so we can return the FXID, team and sequence_id
   to filter down which sequences we want from the overall database */
  SELECT
    FXID,
    team_id,
    sequence_id,
    row_num as try_row
  FROM
    row_query
  WHERE
    `action` = 9
)
/* Now we can filter only sequences that contain a try and only the events leading upto the try
 by ensuring the row_num of the event is less than or equal to the row num of the try
 and finally use GROUP_CONCAT to create a sequence of all the events ordering by row number */
SELECT
  rq.FXID,
  rq.team_id,
  rq.sequence_id,
  GROUP_CONCAT(e.event_ ORDER BY rq.row_num) as actions
FROM
  row_query rq
JOIN
  try_action_row t
ON rq.FXID = t.FXID
AND rq.team_id = t.team_id
AND rq.sequence_id = t.sequence_id
AND rq.row_num <= t.try_row
JOIN events_ e
ON e.action_ = rq.`action`
GROUP BY 1,2,3
ORDER BY 1,2,3

+-------+---------+-------------+---------------------------------------------------------------------------------------------------------------------------------------------+
| FXID  | team_id | sequence_id | actions                                                                                                                                     |
+-------+---------+-------------+---------------------------------------------------------------------------------------------------------------------------------------------+
| 23169 | 1350    | 19          | Possession,Sequence,Pass,Carry,Ruck,Pass,Pass,Pass,Carry,Ruck,Pass,Pass,Carry,Ruck,Pass,Attacking Qualities,Carry,Ruck,Carry,Ruck,Carry,Try |
| 23169 | 1350    | 60          | Possession,Collection,Carry,Pass,Kick,Ruck,Collection,Pass,Pass,Pass,Pass,Attacking Qualities,Attacking Qualities,Carry                     |
| 23169 | 1350    | 83          | Possession,Sequence,Maul,Carry,Try                                                                                                          |
+-------+---------+-------------+---------------------------------------------------------------------------------------------------------------------------------------------+
It performs a similar function to the Cypher query but it’s not perfect as it’s a bit more difficult to ensure the ordering of events is exactly right. It took around 5 minutes to return all the tries in the database so it’s nowhere near as performant as a Graph Database query (although I’m sure my SQL could be optimised - answers on a postcard please!).
Collating all the Sequences
The first task after retrieving all the event sequences from the graph database was to collate them in Python. For this I created a dictionary with each Team as a key and for each team, created two lists to store all the event sequences and the duration of each sequence
def collate_sequences(events):
    """
    Collect all the try scoring sequences by team
    Input:
    - events - [[teamName, [events], duration]]
    Output:
    - {teamName, [[events]], [durations]}
    """

    teamNames = {x[0]: {'events': [], 'durations': []} for x in events}

    for (team, event, duration) in events:
        teamNames[team]['events'].append(event)
        teamNames[team]['durations'].append(duration)

    return teamNames

teamEvents = collate_sequences(events)

print('Event Sequence: ', teamEvents['Harlequins']['events'][0])
print('Duration of sequence:', teamEvents['Harlequins']['durations'][0], 'seconds')

>>> Event Sequence:  ['Tackle', 'Tackle', 'Tackle', 'Tackle', 'Tackle', 'Tackle',
                     'Collection', 'Attacking Qualities', 'Pass', 'Pass', 'Attacking Qualities',
                     'Carry', 'Attacking Qualities', 'Carry', 'Pass', 'Carry',
                     'Attacking Qualities', 'Attacking Qualities', 'Attacking Qualities',
                     'Carry', 'Pass', 'Collection', 'Carry', 'Carry', 'Kick', 'Collection',
                     'Attacking Qualities', 'Carry', 'Try']
>>> Duration of sequence: 102 seconds
What is the distribution of try scoring durations?
Now we can have a look at the length of each try scoring sequence per team. We first need to summarize the list of durations associated with each team:
# Create a dict to score all the statistics for each team
sequence_lengths = {team: {'mean_events': 0, 'min_events': 0, 'max_events': 0, 'std_events': 0,
                           'mean_time': 0,  'min_time': 0, 'max_time': 0, 'std_time': 0,}
                            for team in teamEvents.keys()}

# Iterate through each team and calculate the statistics
for team in teamEvents.keys():

    sequences = [len(seq) for seq in teamEvents[team]['events']]
    sequence_lengths[team]['mean_events'] = np.mean(sequences).round(2)
    sequence_lengths[team]['min_events'] = np.min(sequences).round(2)
    sequence_lengths[team]['max_events'] = np.max(sequences).round(2)
    sequence_lengths[team]['std_events'] = np.std(sequences).round(2)

    times = [time for time in teamEvents[team]['durations']]
    sequence_lengths[team]['mean_time'] = np.mean(times).round(2)
    sequence_lengths[team]['min_time'] = np.min(times).round(2)
    sequence_lengths[team]['max_time'] = np.max(times).round(2)
    sequence_lengths[team]['std_time'] = np.std(times).round(2)

# Create a DataFrame to easily see the results tables
pd.DataFrame(sequence_lengths).T

If we take a few teams, we can graph out the distribution of try scoring sequence durations
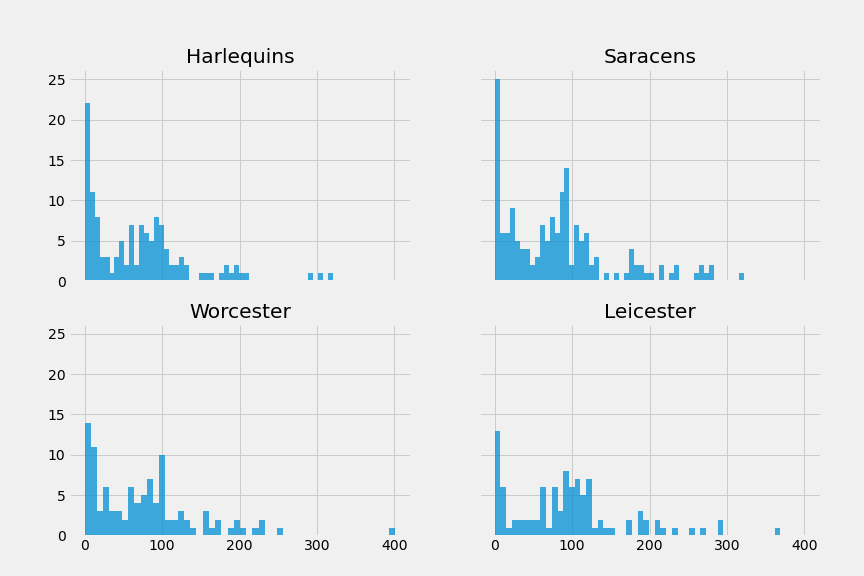
Interestingly, we can see that it looks very similar for all four teams. A lot of tries are scored quickly (assuming 1st/2nd phase), there’s a bit of a dip up until around a minute and then it picks up again from 75s to 120s.
Do the types of actions vary by team?
The next question: Does the proportion of each action in a try scoring sequence differ much by team? For example, does one team have a much higher proportion of kicks or carries or passes etc?
Let’s start by getting each of the types of action:
distinct_actions = set(action for seq in events for action in seq[1])
print(distinct_actions)
>>> {'Pass', 'Collection', 'Tackle', 'Goal Kick', 'Offensive Scrum',
>>> 'Defensive Scrum', 'Attacking Qualities', 'Try', 'Missed Tackle',
>>> 'Restart', 'Kick', 'Lineout Throw', 'Turnover', 'Penalty Conceded',
>>> 'Carry', 'Won Clean'}
Strangely, Maul doesn’t come up in the list of actions so that must be used as one of the different descriptors in the dataset (John Wells wouldn’t be happy…). We can now create a summary for each team.
def summarize_action_types(events):
    """
    Collect all the try scoring sequences by team
    Input:
    - events - [teamName, [events], duration]
    Output:
    - {teamName {event: proportion}}
    """

    # Create a nested dictionary for storing each teams actions
    action_types = {team: {action: 0 for action in distinct_actions} for team in teamEvents.keys()}

    # Increment a count of each action while iterating through each event
    for (team, event, duration) in events:
        for action in event:
            action_types[team][action] += 1

    # To convert this to a proportion, we can iterate through each team and sum up the total number
    # of each type of action
    for team in action_types.keys():
        i = 0

        # Create a sum total of all actions for a team
        for action in action_types[team].keys():
            i += action_types[team][action]

        # Take each count of actions and divide by the sum to convert to a percentage
        for action in action_types[team].keys():
            action_types[team][action] /= i / 100

    return action_types

percentages = summarize_action_types(events)
df = pd.DataFrame(percentages).T.round(2)
And here’s what the results look like
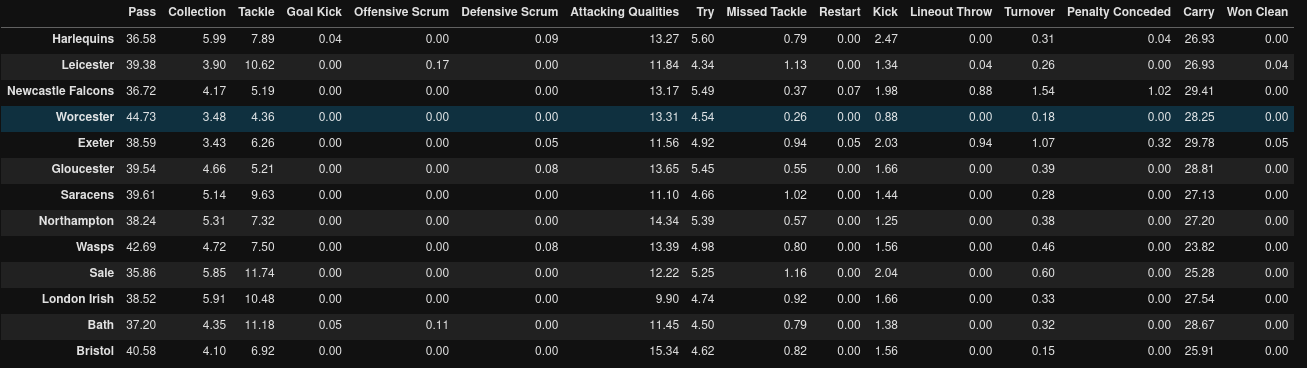
Looking at the Attacking Qualities column (attacking qualities are actions such as breaks and offloads), we can see that Bristol have the highest proportion of these with about 15.34% of all events in their try scoring sequences. Quins top the chart of the kickers when it comes to scoring sequences with 2.47% of all events being kicks…Worcester are the worst for this with only 0.8%. Finally, which team carries the most during their try scoring sequences? It’s probably no surprise that Exeter top the list here closely followed by the Falcons with 29.8% and 29.4% respectively. Wasps come bottom of the list for carries but rank fairly highly for the proportion of passes (42.7% passes)
Which players are the most involved in the try scoring sequences?
So we’ve looked at the try scoring sequences by team, but can we see which players have the most involvements per try? We’ll run this little number with Cypher.
/* Match all events as part of a try scoring sequence */
MATCH p=(e:Event)-[:NEXT_EVENT_PER_TEAM*..100]->(t:Try) WHERE e.sequenceId = t.sequenceId

/* Ensure we only take the longest path. Without this, the query would return
 every shorter path that made up the bigger path */
MATCH (pre:Event)-[:NEXT_EVENT_PER_TEAM]->(e) WHERE pre.sequenceId <> e.sequenceId

/* Get the team name and fixture id for the event that starts each sequence */
MATCH (team:Team)-[:FIXTURE_EVENT]->(e)<-[:HAS_EVENT]-(f:Fixture)
WITH team.name as teamName, t.sequenceId AS seqId, nodes(p) as events, f.fxid as fxid

/* Iterate through all of the events in each sequence */
UNWIND events AS event

/* Match the player the event was attributed to */
MATCH (event)<-[:INDIVIDUAL_EVENT]-(p:Player)

/* Remove scrum halfs as they rank highest anyway due to num passes */
WHERE NOT EXISTS((p)-[:HAS_APPEARANCE]-(:Appearance {posId: 9}))
WITH
  teamName,
  COUNT(DISTINCT toString(seqId) + toString(fxid)) as numTries,
  p.forename + ' ' +  p.surname as playerName,
  COUNT(*) as countPlayer,
  toFloat(COUNT(*))/toFloat(COUNT(DISTINCT toString(seqId) + toString(fxid))) as actionsPerTry
WHERE numTries >= 5
RETURN teamName, numTries, playerName, countPlayer, actionsPerTry  ORDER BY actionsPerTry DESC
We can see in the screenshot what the results look like:
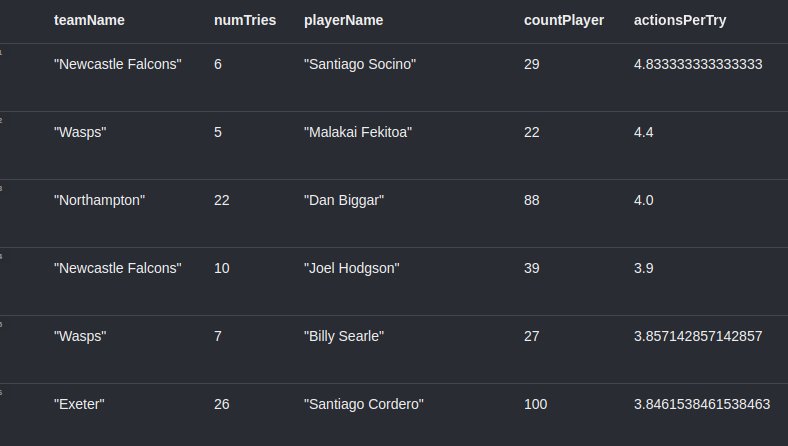
Newcastle Falcons Academy graduate Santi Socino tops the chart closely followed by Wasps Fekitoa. We can dig a bit deeper and see how one of these sequences is represented by the graph.
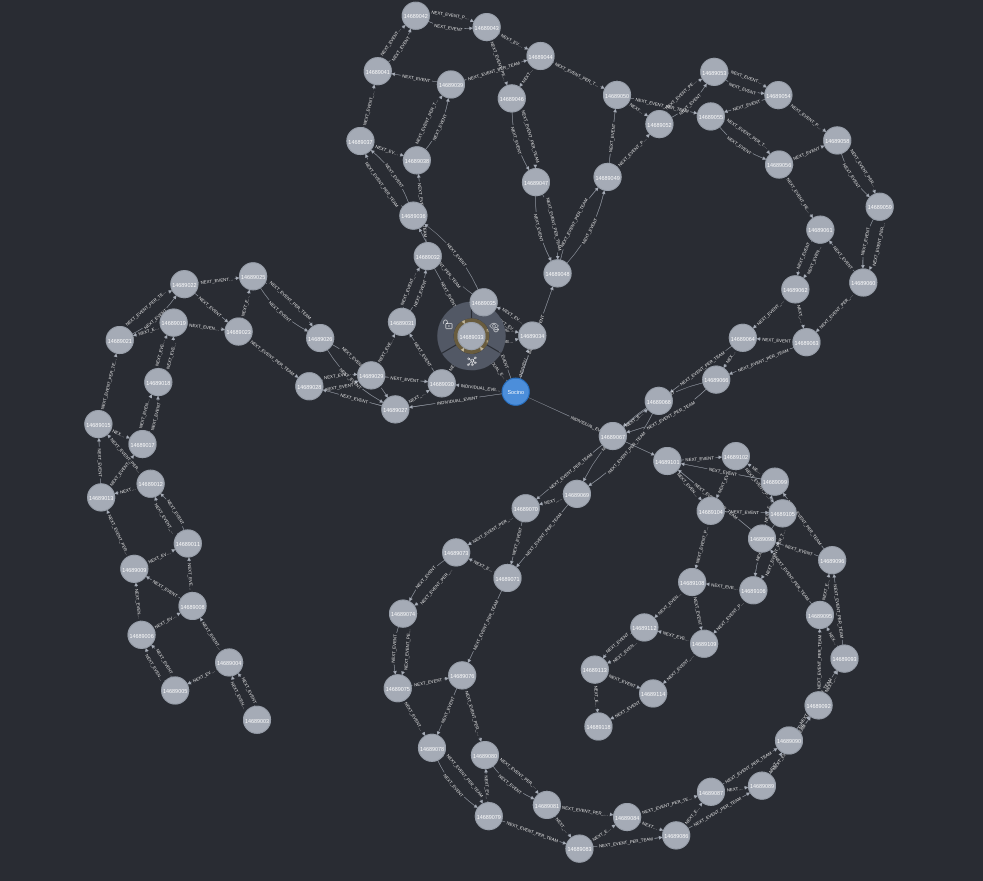
Above is the entire sequence of all plays leading up to the try with all the links between them. You’ll notice we almost have two parallel lines of events which is representing the events of each team and we could traverse these relationships either by each event in sequential order (using the :NEXT_EVENT relationship) or just by a single team’s events (using the :NEXT_EVENT_PER_TEAM relationship that we created when we loaded the graph). If we only include the involvements of Santi, we get a better idea of how he clocked up so many involvements in one sequence
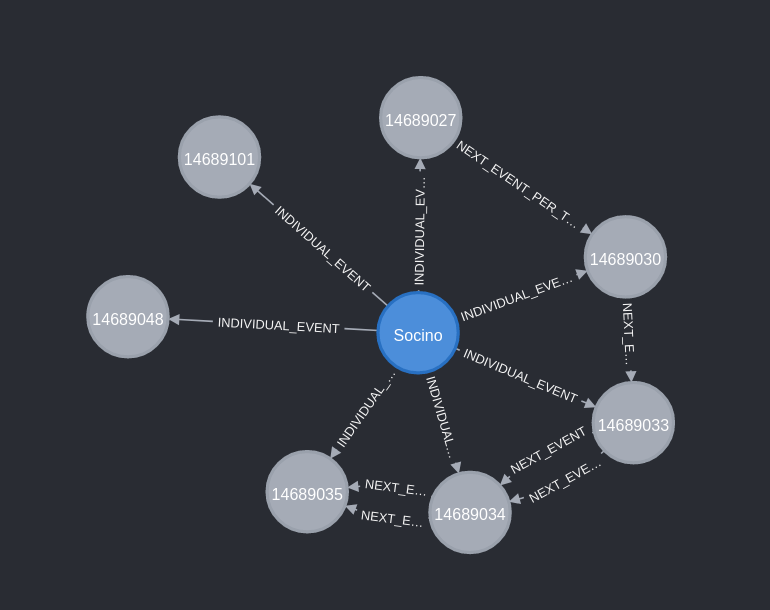
There were five successive events:
- Attacking Qualities, Defender Beaten
- Attacking Qualities, Defender Beaten
- Attacking Qualities, Initial Break
- Carry, Crossed Gainline, Pass
- Complete Pass
And then if we look at the other two events he was involved in we see he also had another pass and another carry in the sequence leading up to the try.
Closing Remarks
Hopefully this has been an interesting look into modelling rugby data with Graph Databases. Cypher and Neo4j gives us the ability to query sequences and relationships in a much more efficient manner than traditional databases.
P.S. Hi Tim.
P.P.S Hi Mark.